

Whether you’re building a mobile app from scratch or evaluating an existing app, developers will find debugging an essential skill to master. Debugging is the process of identifying and resolving errors in software systems and mobile apps.
Most Integrated Development Environments (IDE) come with built-in debugging tools that enable a developer to review the inner workings of your projects line by line, but occasionally these debuggers may not be able to achieve exactly what you want. Even worse, if you’re checking for bugs, reverse engineering, performing mobile application security testing or analyzing performance on a mobile app for which you do not have the source code, debugging can quickly become a very daunting task.
When you lack access to an app’s source code, you can debug an app by conducting static or dynamic analysis. In this post, we will discuss how to leverage Frida for manual dynamic analysis to understand the inner workings of an application.

What Is Frida?
Frida is a free, open-source dynamic instrumentation toolkit for developers, reverse engineers, and security researchers created and supported in part by NowSecure researchers. Frida can be used on a variety of different platforms, such as Mac, Windows, iOS, Android, and embedded systems. The framework allows users to hook into the memory of running processes and view or manipulate the inner workings of the application. Frida hooks are typically written in Javascript, though Frida provides bindings for multiple other languages.
Leverage the Community
The large community of Frida enthusiasts generously provides tools and scripts utilizing Frida’s capabilities to assist developers and researchers around the world. You can find these tools in various places on the Internet, however, the official place to find premade Frida scripts is Frida CodeShare. This section will touch on just a few of these helpful publicly accessible tools/scripts. We encourage you to search for more or even contribute your own creations.
To easily use scripts from the CodeShare, run Frida with the codeshare flag:frida --codeshare <author>/<the-script-name> -f <package-name>
Note: If you are using this on a device connected via USB, add the -U flag
If the script isn’t included on the CodeShare, you’ll need to save the script to a Javascript file and run it with the following command:frida -l <path-to-script> -f <package-name>
Frida is a very capable debugging tool that should have a place in every developer’s toolkit.
Class/Method Inspection
Sometimes you want to see what classes or methods are being used while an application is running. You can use these Frida scripts to log any time a specific class or method is called. In addition, every argument that is used will also be displayed alongside the method’s return value.
iOS
For iOS, this script provides an easy way to hook Objective-C or native methods. To use it, pass the method declaration that you’re interested in as an argument to the trace function at the bottom of the script. For example, if you wanted to hook any classes that have a method name that ends with the word “Password”, you could use this:*[* *Password:*]
If this syntax looks confusing, you may want to check out this explanation of Objective-C method declarations.

Android
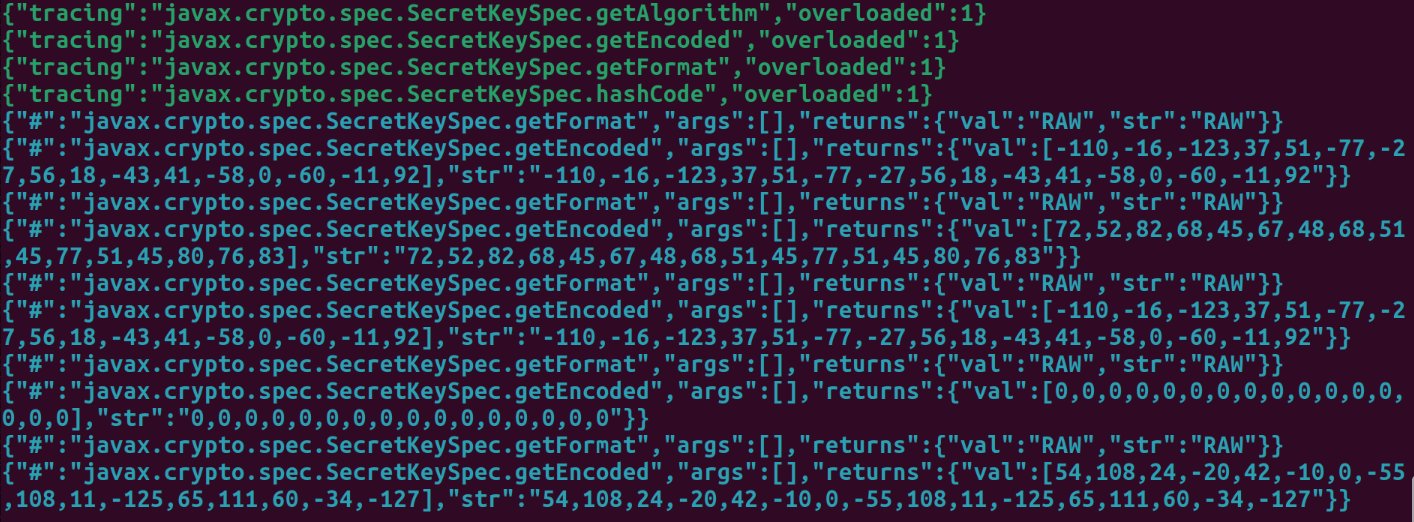
For Android, use this script to hook all Java methods for the provided class. This script is used by placing the full class name in the array at the bottom or by calling traceClass() directly. For example, if you wanted to hook all methods from the SecretKeySpec class, you could use this:traceClass(“javax.crypto.spec.SecretKeySpec”)
View File Interactions
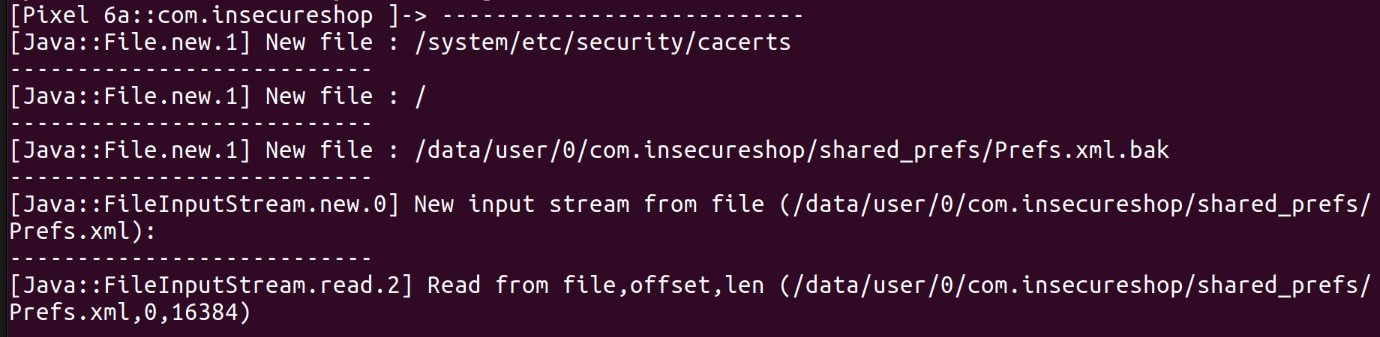
Occasionally you may want to inspect what’s getting read from or written to disk. You can use this File System Access script to accomplish that. This script will display every file creation, open, read, and write that an Android app performs.
Dump Application Memory
An application’s memory can contain all sorts of sensitive or useful information. The easy-to-use tool Fridump allows you to quickly dump app memory to disk for further analysis. You can use it with:python3 fridump.py -U -o memory_dump <app-name>

You can search for passwords, API keys, unobfuscated strings, debug symbols and other sensitive information by running strings on the output.
Trace Method Calls
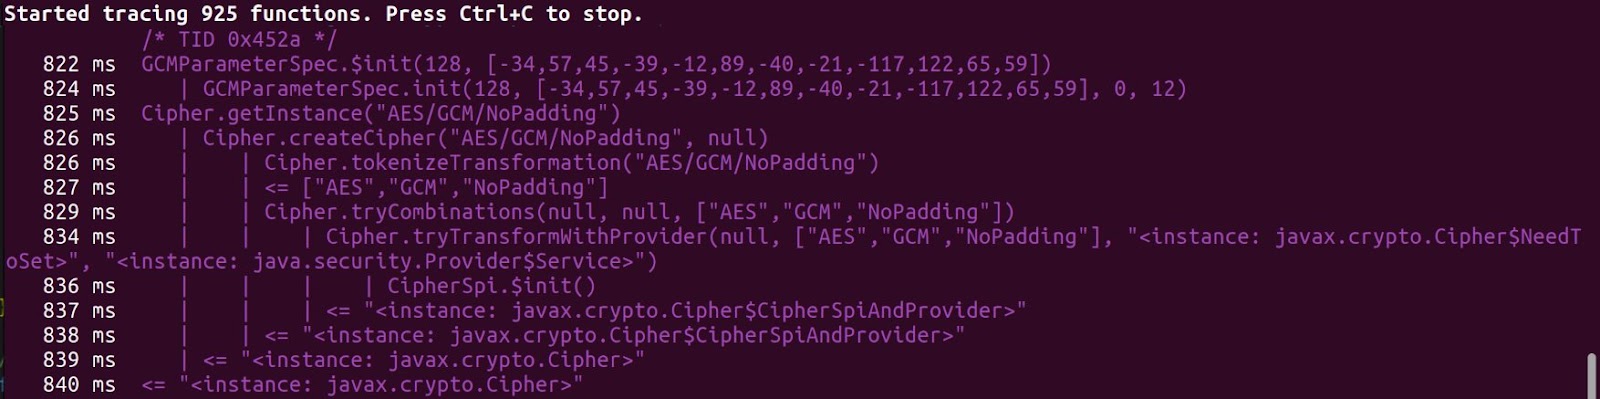
frida-trace allows you to dynamically trace function calls by providing class/method names. frida-trace also allows for wildcards, so you can hook multiple calls at once without knowing the complete method names. For example, if you want to monitor the Java cryptographic libraries of an application, you could use:frida-trace -U -f <app-package-name> -j '*crypto*!*/i'
In the above instance, there were 925 matches for methods that had crypto in the class name. Upon launching the app, it was determined that this app uses AES GCM. The trace also shows the IV that was used to initialize the cipher. From here, you could narrow down your tracing to only classes related to AES GCM.
Writing Your Own Scripts
In addition to using prebuilt tools and scripts, it can be helpful to know how to write a basic Frida script. Occasionally tools output too much information and it can be very time consuming to sift through. This section will discuss how to create a basic Frida script for Android using the Javascript API. Other platforms may be slightly different, but the idea is the same.
DIY Frida Script
Before you start writing your script, you must perform the following steps to ensure that you have all the necessary information.
- Identify the class and method name you are interested in.
- This can be done by looking at the source code. If the source is not available, try running the app through a decompiler such as JADX-GUI
- Determine if this call is found in native code or not.
- If the method is found in a shared object or dylib, then it is native.
- Determine if the method has any overloads.
- If there are overloads, take note of the type and total number of parameters that each overload accepts.
Non-Native
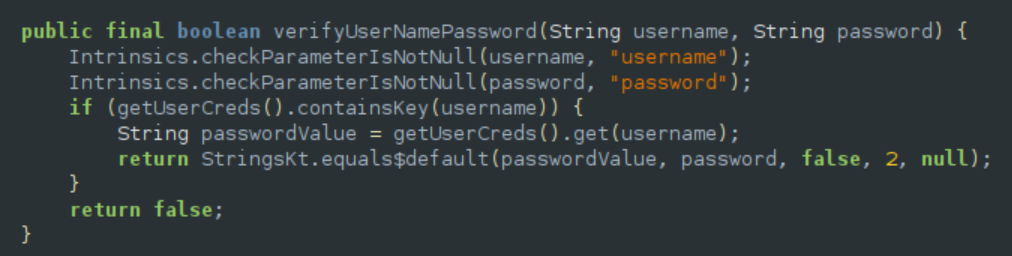
For this example, we will be inspecting the values that are passed into this login verification function:
Since we want to hook a Java method, we want to ensure that the JVM is loaded before we attempt to hook into the method’s functionality. This can be done by wrapping your hook in:Java.perform(function(){})
Next, we need to assign a variable to the class that we want to hook:const verifyLogin = Java.use(“com.insecureshop.util.Util”)
After that, we need to hook into the implementation for the method (and overload) that we are interested in. Overload parameters are described by their corresponding Dalvik TypeDescriptors.
Util["verifyUserNamePassword"].overload("java.lang.String", "java.lang.String").implementation = function (username, password){}
Next, we’ll overwrite the original functionality of the method. Remember that we must return the proper value from the custom implementation or the app may crash. A completed hook could look like this:
Java.perform(function(){
  	const Util = Java.use("com.insecureshop.util.Util");
 	 Util["verifyUserNamePassword"].overload("java.lang.String", "java.lang.String").implementation = function (username, password) {
      	console.log(`Util.verifyUserNamePassword is called: username=${username}, password=${password}`);
     	 let result = this["verifyUserNamePassword"](username, password);
      	console.log(`Util.verifyUserNamePassword result=${result}`);
      	return result;
  	};
})
Native
Native code is hooked slightly differently than non-native code. Instead of generating a wrapper for the non-native class and overwriting the implementation, Interceptor is used to obtain the native method’s address in memory. In this example, we will be hooking the behavior of the C standard library read call. You can typically use official documentation to understand the parameters and return values of what you are hooking.
First, we need to get the memory address of the method we want to hook. This can be done as follows:Module.getExportByName('libc.so', 'read');Next, use Interceptor to attach to the memory address:Interceptor.attach(Module.getExportByName('libc.so', 'read'),
{
onEnter(args) {},
onLeave(retval) {}
}
});Now, use the onEnter and onLeave callbacks to print out the values of the arguments. If we wanted to print out the contents that were read from each file, the hook could look like this:
Interceptor.attach(Module.getExportByName('libc.so', 'read'), {
    onEnter(args) {
      this.buffer = args[1]
    },
    onLeave(retval) {
      if (retval.toInt32() > 0) {
        console.log(`Read ${retval.toInt32()} byte(s)`);
        const read = Memory.readByteArray(this.buffer, retval.toInt32());
        console.log(read);
      }
    }
  });
Note: Notice how this is used to store the arguments to be used in the onLeave callback. This provides an easy way to pass values in between callbacks.
Conclusion
Frida is a very capable debugging tool that should have a place in every developer’s toolkit. Whether you are using preexisting tools and scripts or writing your own, the possibilities for developing new debugging techniques are endless.
Learn more Frida tips and tricks in a dedicated conference track on Oct. 11, 2023, at NowSecure Connect 2023, the premiere mobile app security and privacy event for mobile AppDev, AppSec, privacy and DevSecOps leaders, practitioners and industry experts. Joining any Frida or Radare session will earn you the chance to win a special Zoom call with the creators of Frida and Radare. Register for the free virtual conference today.
")

